General remarks on nomograms and alignment charts
Nomograms in the time of spreadsheets and electronic
calculators?
Diagrams and nomograms are not just graphics
Comparison between line diagram and alignment chart
![]() Deutsche version hier
Deutsche version hier
![[To top/bottom of page]](../z_designs/nav-dnup.gif) Nomograms in the time of spreadsheets and electronic calculators?
Nomograms in the time of spreadsheets and electronic calculators?
| Accuracy | Spreadsheet and electronic calculator pretend high accuracy – but most time input data is inaccurate. Hence what's the purpose of those 3 to 7 figures after the decimal point? |
| Usage | Although there are many devices powered by a small solar panel – the battery is low in many cases, if you do not use the calculator daily. A stained photo copy of a nomogram can still be used. I hear some people complain that alignment diagrams require a straight edge or ruler to be read. Take any sheet of paper, even with ripped off borders and fold it once: there you have a straight edge! |
| Dissemination | Technical magazines and books can present nomograms in an easy way. However they must not be scaled down to much, because many lines will clinch together then. A copy of such a graph may well be unusable. |
| Available data | To calculate results according to a given formula requires data to serve all variables to the left of the equal sign. Only few users of such formulas are capable to re-arrange the formula to allow to find a variable from a given result and the other variables. If part of the formula reflects empiric knowledge you have no chance to re-arrange it. A nomogram does this automatically: just use those scales you know. |
Diagrams and nomograms are not just graphics
In contrast to illustrations and many types of technical drawings the elements in diagrams and nomograms may not be rearranged in any manner. There are mathematical or empirical interrelations. Hence the word. Nomos (plural: Nomoi) is greek for law. It is the origin of the suffix -onomy, as in astronomy, economy, or taxonomy. The french word for nomogram is abaque which reminds the abacus, the calculation device. The spelling nomograph is also in use for nomogram. Looking to the greek roots the word nomograph is more consistent then nomogram.
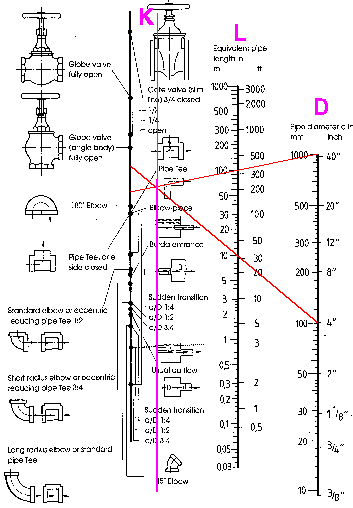 |
This alignment chart (a form of nomograms) is used to calculate the equivalent pipe length for various valves and fittings to calculate the head loss in piping. Faulty diagram: Artists have copied and copied this (proven by subtle details in various copies I have found) this diagram without knowing what they do. They needed more room for the middle column of drawings and moved the pivot line to the left. The correct location of the pivot line is in pink. The underlying formula is very simple. The empirical element are values for K marked on the pivot line which depend on the type of fitting or valve. You get the equivalent length L by this formula: L = K x D. When dividing L by D you get a particular K. with 10*L / 10*D you should get the same value K. This is indicated by the red lines. Since K can be found only by experiments, the source of the used data must be given in a diagram. This is missing here also. I have re-developed this diagram for the Durchfluss-handbuch (ISBN
3-9520220-3-9), english version Flow Handbook (ISBN 3-9520220-4-7), published
by the company Endress
+ Hauser Flowtec in Reinach/CH (see
|
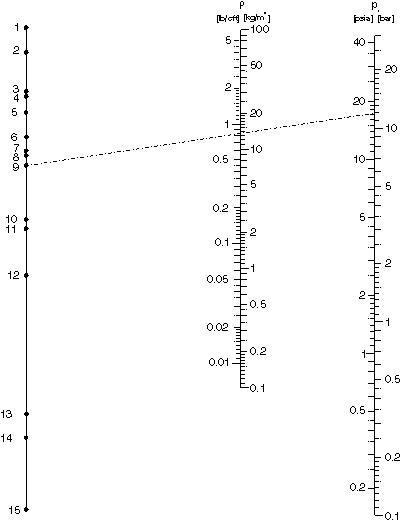
Comparison between line diagram and alignment chart
Practitioners often request line diagrams because they are familiar to them. Most time this type of nomogram needs less space than an alignments chart for more complicated cases. Alignment charts have one pivot line for two scales, which may proliferate soon and require much space.
On the other hand alignment chart can be much more clear and transparent. The argument to require a straight edge or rule is frailly because any sheet of paper can be folded to create a mathematically straight line!
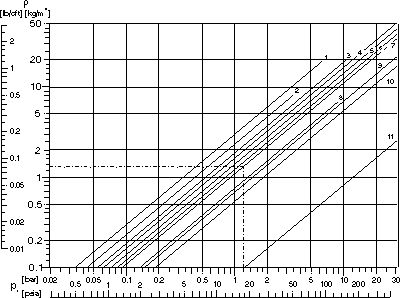
Density of various gases depending on pressure
| Line diagram | Alignment chart | ||||||||||||||||||||||||||||||||||||||||
|---|---|---|---|---|---|---|---|---|---|---|---|---|---|---|---|---|---|---|---|---|---|---|---|---|---|---|---|---|---|---|---|---|---|---|---|---|---|---|---|---|---|
The gases are numbered in the charts:
|
|